Hosting your sites through a service such as Clever Cloud is not just about sending your files to a server. It is gaining in simplicity of execution, in velocity, and more importantly, ensuring that they are kept in operating conditions.
For each application or add-on deployed, you automatically get services such as backups, log management or metrics monitoring. So you can be assured that you are ready for production.
A new metric tile
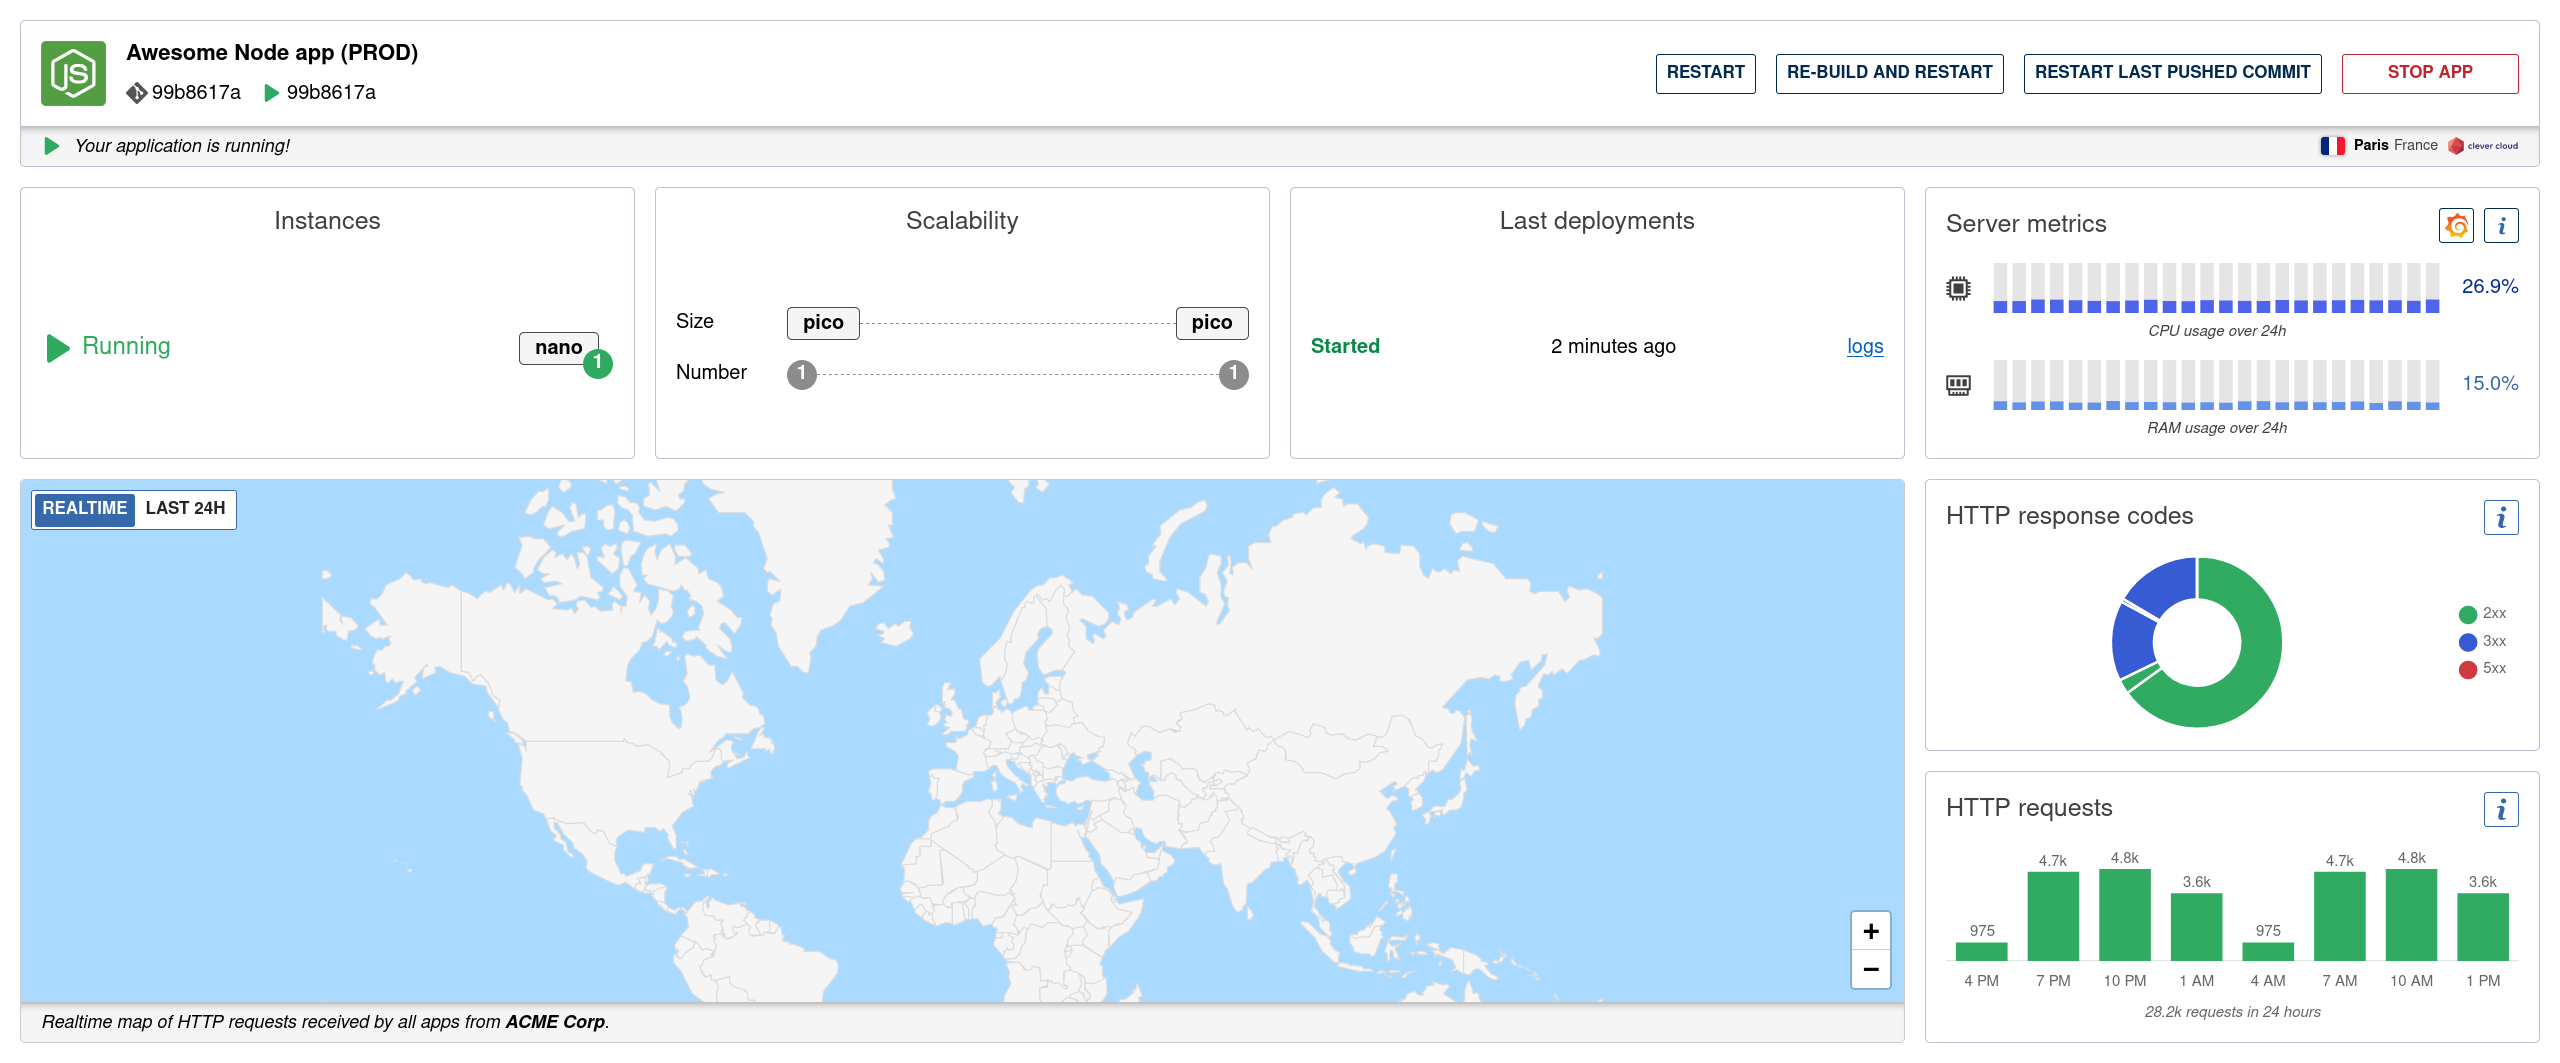
This also includes a number of features that make it easy for you to access essential information through our Console. Among its recent improvements, we added a new “tile” in the overview of each of your applications:

Here you will find the vCPU and memory usage over a 24-hour period, in the form of a graph with 24 bars, each representing one hour. An average value is also displayed, corresponding to the last hour.
A three-level color scheme allows you to instantly identify a situation that needs your attention, or to make sure that everything is fine. An information panel explains how the elements are working and you have shortcuts to more complete metrics or to the Grafana dashboard related to your application.
And if you don’t want to have to worry about the load level of your application and want to feel more peaceful, think about activating the auto-scalability. It allows you to constantly increase or decrease the size or number of your instances as needed, while respecting the limits you defined.
A convenient and accessible web component
Of course, this tile has been developed as a Web Component, documented here, that you can freely use. It is also the first one to follow our accessibility rules, from buttons and links to screen reader handling: it will feature a table for the graphic.


